Observation and survey · Tool 1 of 12
Biodiversity Baseline Survey
Create a repeatable ecological starting point before intervention, while keeping a practical baseline distinct from a species list or professional ecological assessment.
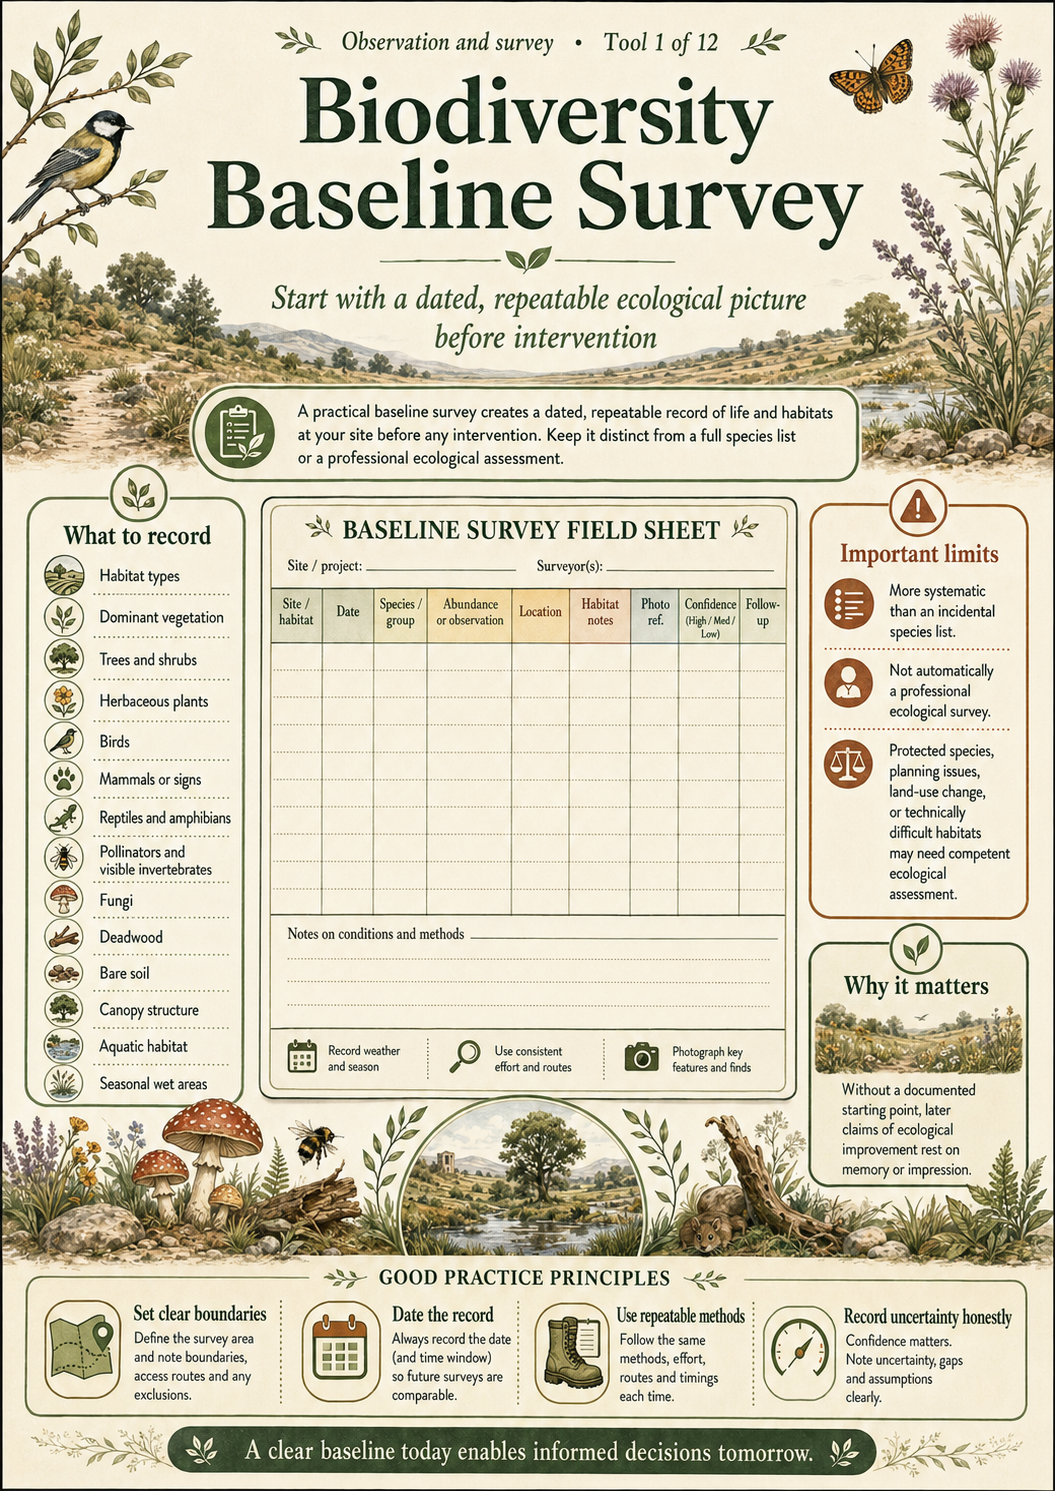
The detailed article and accessible semantic visual below provide the complete HTML text equivalent of the infographic, including its method, cautions and interpretation.
Why this tool matters
Without a documented starting point, later claims of ecological improvement rest on memory or impression. A useful baseline asks: what do we need to know now so that we can later determine whether the system has genuinely changed?
What the tool is
A practical biodiversity baseline is a bounded, dated account of habitats, observable organisms and structural features before significant intervention. It can include habitat types, dominant vegetation, trees and shrubs, herbaceous plants, birds, mammals or signs, reptiles and amphibians, pollinators and other visible invertebrates, fungi, deadwood, bare soil, canopy structure, aquatic habitat and seasonal wet areas.
It is more systematic than an incidental species list, but it is not automatically a professional ecological survey. Protected species, planning, land-use change and technically difficult habitats may require competent ecological assessment.
Origins and disciplinary context
Baseline survey is established across ecology, conservation and environmental assessment. Permaculture practitioners can adapt its disciplines of boundary, timing, method and repeatability without claiming that a simple field exercise replaces formal ecological practice.
The tool at a glance
Biodiversity baseline field sheet with columns for site, date, species or group, observation, location, habitat notes, photograph reference, confidence and follow-up.
| Site / habitat | Date | Species / group | Abundance or observation | Location | Habitat notes | Photo ref. | Confidence | Follow-up |
|---|---|---|---|---|---|---|---|---|
| Woodland edge | YYYY-MM-DD | Record identification or group | Count, DAFOR or described sign | Fixed plot, point or grid ref. | Canopy, ground cover, deadwood, moisture | BB-01 | High / medium / low, with reason | Repeat, verify or seek expertise |
When to use it
Use before substantial planting, clearance, grazing, earthworks or management change, and when setting monitoring questions. Define the survey boundary, purpose, season, duration, effort and recording method before beginning. Repeat across relevant seasons because detectability changes with weather, life cycle and observer skill.
How to use it
- State the management question and map the survey boundary.
- Divide the site into meaningful habitats or sampling units.
- Select repeatable methods appropriate to the organisms and available competence.
- Record effort, timing, weather and observer as well as observations.
- Photograph fixed features and keep uncertain identifications uncertain.
- Identify gaps requiring another season, specialist survey or professional advice.
- Store the baseline so later records can be compared with the same definitions.
What to record
Record location, habitat, date, time, weather, method, survey effort, species or group, abundance or sign, confidence, photograph reference, structural features and follow-up. Absence from a record means “not detected by this method at this time”, not necessarily “absent from the site”.
Worked example
Illustrative Vila Pinheiro woodland exercise. Divide a bounded woodland area into interior, edge and wetter drainage habitat. Record canopy layers, natural regeneration, ground cover, deadwood classes, selected pollinator observations and species richness using the same route and effort in spring and autumn. No historical count is supplied here because the Diploma does not provide a verified baseline dataset for this example.
Connection with Mark’s Diploma practice
Design 08 explicitly proposes biodiversity baseline surveys using species count and richness, with increased species richness and habitat diversity as desired outcomes. This supports the intended monitoring method; it does not prove that a complete baseline dataset or improvement trend was achieved.
Diploma source locators
- Design 08, PDF page 14: biodiversity baseline surveys, species count and richness, monitoring cycle and desired outcomes.
- Design 08, Appendix 03, PDF page 75: biodiversity baseline surveys and species richness tracking listed under Observation Tools.
Interpreting the results
Compare like with like: the same boundary, season, effort and method. Treat changes as signals for enquiry. A higher count may reflect season, detectability or effort rather than ecological improvement; a lower count may reflect weather or observer difference rather than loss.
Limitations
- Short surveys miss seasonal, nocturnal, cryptic and difficult-to-identify organisms.
- Species richness alone says little about abundance, condition, rarity or ecological function.
- Access, safety, law and protected-species responsibilities remain active.
Common mistakes and misuse
- Changing the boundary or method without recording it.
- Presenting uncertain identifications as certain.
- Equating “not detected” with absence.
- Using a practitioner baseline to avoid necessary professional assessment.
Relationship to other Library tools
Reflection and application questions
- Which future design claim will this baseline allow you to test?
- Which seasons, taxa or habitats are most likely to be under-detected?
- What evidence would trigger specialist advice?
References and further reading
- Chartered Institute of Ecology and Environmental Management, Guidelines for Preliminary Ecological Appraisal, second edition, 2017.
- Defra, “30by30 on land: assessing whether land can contribute”, baseline and monitoring guidance.