Monitoring and evaluation · Tool 7 of 12
Ecological Indicators and KPIs
Translate broad regenerative goals into observable evidence, explicit targets and repeatable measurement protocols without mistaking metrics for causes.
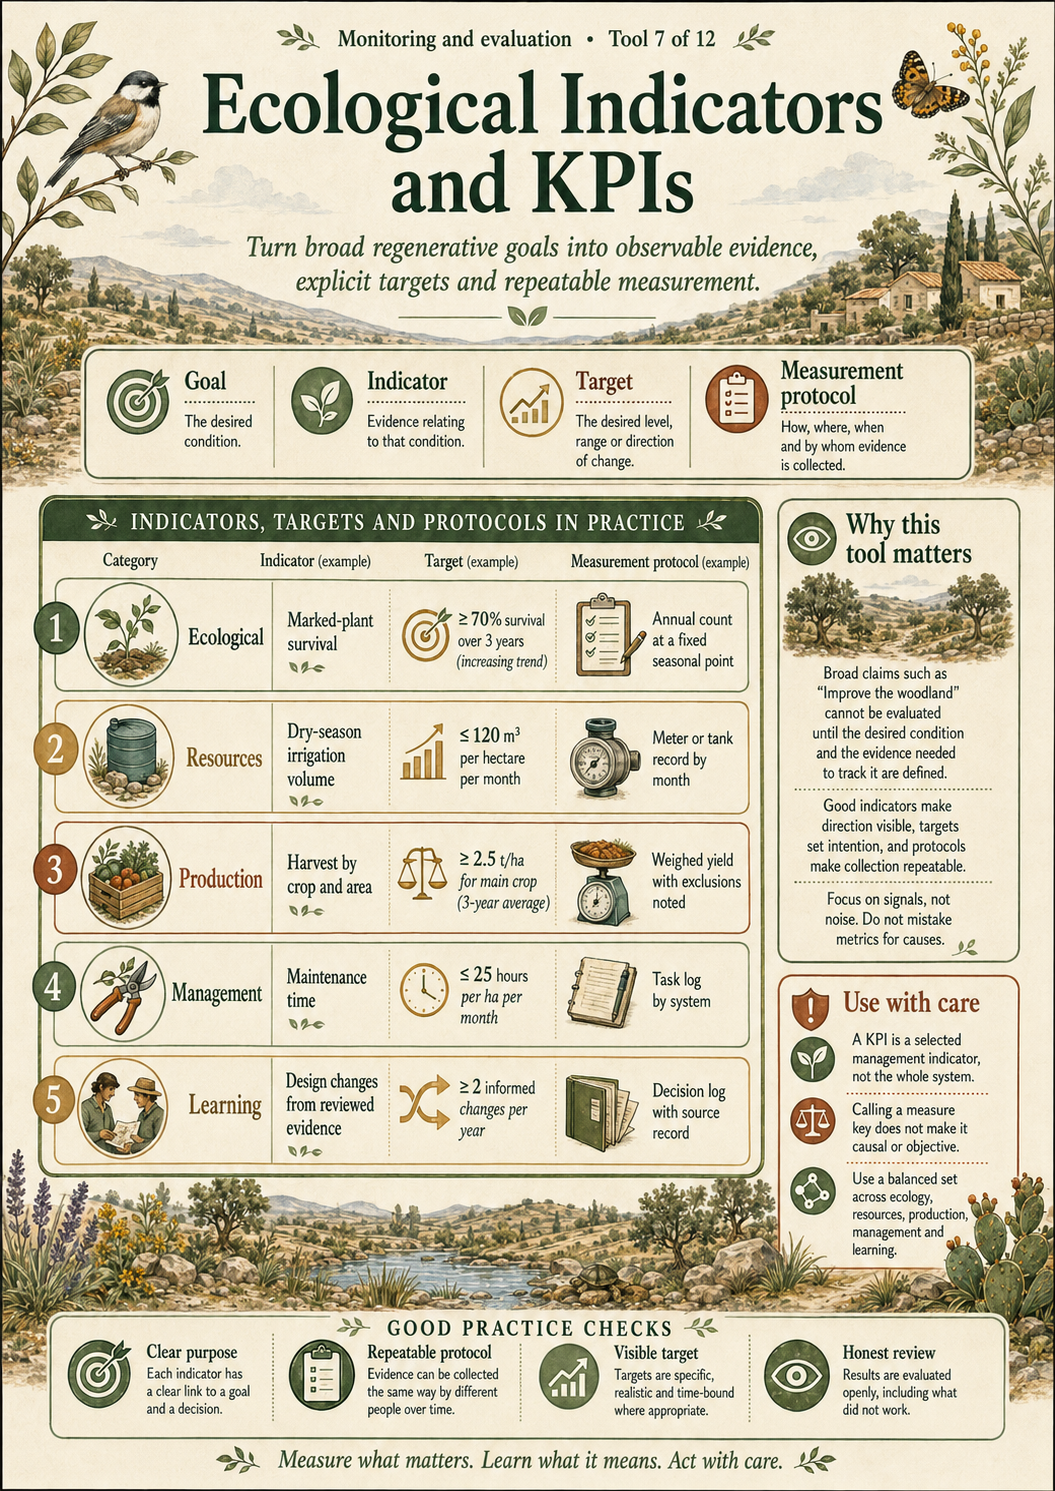
The detailed article and accessible semantic visual below provide the complete HTML text equivalent of the infographic, including its method, cautions and interpretation.
Why this tool matters
“Improve the woodland” cannot be evaluated until desired conditions and evidence are defined. Indicators make direction visible; targets state an intended level or trend; protocols make collection repeatable.
What the tool is
- Goal
- The desired condition.
- Indicator
- Evidence relating to that condition.
- Target
- The desired level, range or direction of change.
- Measurement protocol
- How, where, when and by whom the evidence is collected.
A KPI is a deliberately selected indicator used to support management attention. Calling a measure “key” does not make it complete, causal or objective.
Origins and disciplinary context
Indicators and performance measures are established in ecology, management, evaluation and policy. Regenerative design needs a balanced set because ecological, resource, production, labour and learning outcomes can move in different directions.
The tool at a glance
Regenerative design indicator dashboard with ecological, resource, production, management and learning categories, each showing an illustrative indicator and protocol field rather than actual Vila Pinheiro values.
Ecological
Indicator: marked-plant survival
Protocol: annual count at a fixed seasonal point
Resources
Indicator: dry-season irrigation volume
Protocol: meter or tank record by month
Production
Indicator: harvest by crop and area
Protocol: weighed yield with exclusions noted
Management
Indicator: maintenance time
Protocol: task log by system
Learning
Indicator: design changes from reviewed evidence
Protocol: decision log with source record
When to use it
Use after goals and responsibilities are clear, before implementation locks in assumptions, and during scheduled evaluation. Select the smallest balanced set that can influence a decision.
How to use it
- State the goal and affected system.
- Choose indicators with a plausible relationship to the goal.
- Define units, boundary, method, frequency and responsibility.
- Set targets only where evidence and consequence justify them.
- Record baseline and uncertainty.
- Review ecological, resource, production, management and learning measures together.
- Investigate trade-offs and unintended effects before adapting.
What to record
Record goal, indicator definition, target or desired direction, unit, boundary, method, frequency, data owner, baseline, current result, uncertainty, contextual events, interpretation and decision.
Worked example
Illustrative mixed-woodland framework: goal: establish a resilient mixed woodland. Indicator: establishment survival. Target: a defined threshold after a specified period. Protocol: count marked plantings at the same annual seasonal point. The threshold must come from the design context; this page does not invent one for Vila Pinheiro.
Connection with Mark’s Diploma practice
Design 08 names survival rate, soil moisture retention, weed suppression and early yield on PDF page 23. Its Appendix summary lists soil moisture, plant survival, pest presence and early yield. These are proposed KPIs, not independently verified outcomes or causal proof.
Diploma source locators
- Design 08, PDF page 23: KPIs including survival rate, soil moisture retention, weed suppression and early yield tracking.
- Design 08, PDF page 30: key indicators including tree survival, soil moisture, biodiversity presence and yield.
- Design 08, Appendix 03, PDF page 75: soil moisture, plant survival, pest presence and early yield.
Interpreting the results
Consider direction, magnitude, duration, uncertainty and whether the result agrees with other evidence. A target can focus attention while also distorting behaviour. A KPI can show that two things changed together, not that one caused the other.
Limitations
- What is easy to count can displace what matters.
- Targets may be arbitrary or inappropriate across seasons.
- Composite scores can hide poor performance in one critical area.
- Metrics require continuing data care and review.
Common mistakes and misuse
- Selecting indicators after seeing the result.
- Changing definitions without preserving comparability.
- Reporting percentages without denominator or boundary.
- Treating a dashboard as proof of causation.
Relationship to other Library tools
Reflection and application questions
- Which decision will each indicator change?
- What important condition is missing because it is difficult to measure?
- Could the target encourage harmful shortcuts?
References and further reading
- US Environmental Protection Agency, Evaluation Guidelines for Ecological Indicators.
- Defra, “30by30 on land”, proportional baseline and monitoring guidance.