Cornerstone Guide 5 of 12
Reading a Site Before Designing It
Before placing elements, read the site. Map what exists, observe what moves through it, use zones to examine frequency and care, and label uncertainty so a polished plan never outruns its evidence.
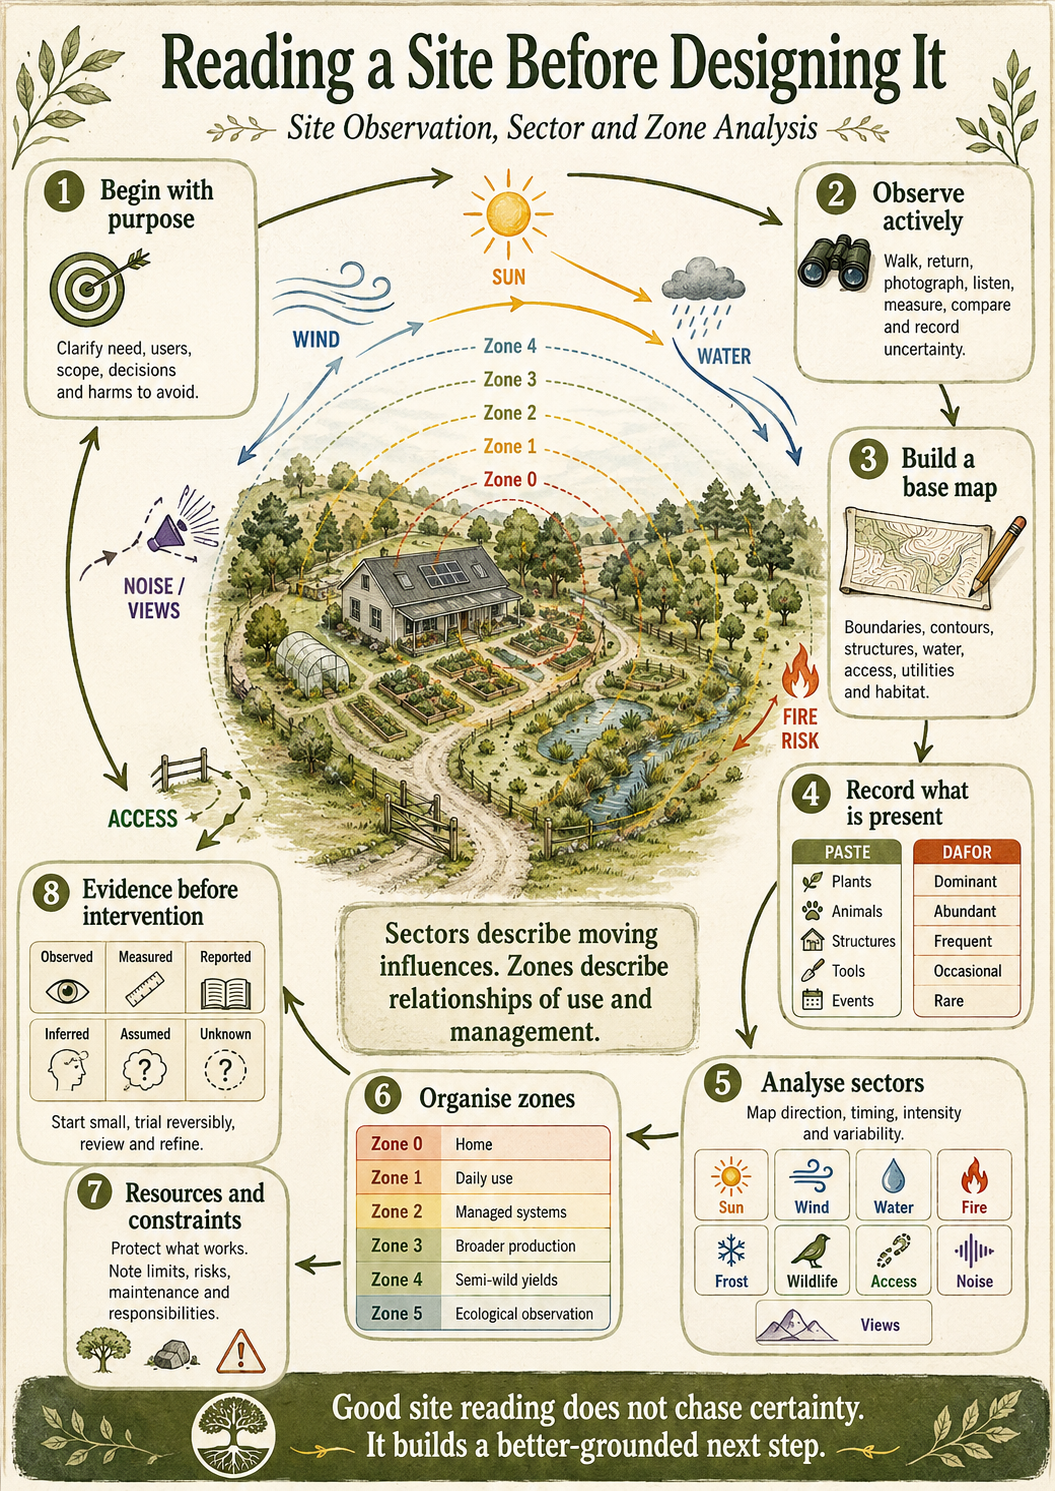
In brief
A useful site-reading process combines:
- a clear purpose and design brief;
- direct observation over time;
- conversations with the people who know and use the place;
- a base map of existing conditions;
- sector analysis of energies and influences moving through the site;
- introductory PASTE and DAFOR records of what is present and how abundant it is;
- resource and constraint mapping;
- zone analysis based on relationships, frequency and intensity of use;
- explicit records of what is known, inferred, assumed and still uncertain.
The purpose is not to collect every possible fact. It is to gather enough relevant evidence to make proportionate decisions and to identify what must be watched before stronger intervention.
Observation is active
Observation is sometimes mistaken for doing nothing. In design, careful observation is active enquiry.
The designer notices patterns, asks questions, checks memories against records and looks for variation. A single visit may reveal slope, access and existing structures. It may not reveal where water accumulates in winter, which summer winds desiccate young plants or how a household actually moves through the land during a working week.
Useful observation can include:
- walking the site at different times of day;
- returning during different seasons and weather conditions;
- photographing the same viewpoints repeatedly;
- recording shade, wind, frost, standing water and erosion;
- noting animal paths, vegetation changes and edge conditions;
- listening to residents, workers and neighbours;
- measuring where measurement would affect a decision;
- identifying contradictions between maps, accounts and direct evidence.
The designer should also record uncertainty. “Not yet known” is legitimate design information. A blank confidently filled with an assumption is not.
Begin with purpose
Observation becomes useful when it is related to a real design purpose. Surveying a site for a family food garden requires different detail from surveying it for a woodland, water system, teaching space or animal rotation.
Before collecting information, clarify:
- What need is the design intended to serve?
- Who uses or depends on the site?
- What change is genuinely required?
- What decisions must the survey inform?
- What harms or burdens must be avoided?
- What is outside the scope of the present design?
A purpose guides attention without pre-deciding the answer.
Build a base map
A base map records significant existing conditions before proposed changes are drawn. It is the common ground on which later observations and design layers can be compared.
Depending on scale and purpose, a base map may show:
- boundaries and dimensions;
- north and orientation;
- contours, slopes and low points;
- buildings, walls and permanent structures;
- roads, tracks, gates and paths;
- watercourses, drains, tanks, wells and wet areas;
- utilities and service routes;
- established trees, hedges and important habitat;
- existing land uses;
- neighbouring features that materially influence the site.
Precision should be appropriate to the decision. A rough sketch may be sufficient for an early conversation. A pond, drainage intervention, building or expensive energy system may require measured survey data and professional technical input.
Do not confuse visual polish with accuracy. A beautiful map containing untested assumptions remains an assumption in a fine coat.
Two introductory tools: PASTE and DAFOR
PASTE and DAFOR are useful early tools for a basic land design. Neither replaces direct observation, a base map or sector analysis. They give the designer simple structures for recording what is present before deciding what ought to change.
Use the public PASTE field tool →
PASTE: what is already part of the site?
PASTE prompts the designer to observe five broad categories:
- Plants
- Animals
- Structures
- Tools
- Events
Plants include cultivated, spontaneous, native, introduced and invasive vegetation. Animals include domestic animals, wildlife, insects, soil life and evidence of animals that are not directly seen. Structures include buildings, walls, fences, roads, drains and other constructed features. Tools include physical equipment as well as systems and practical capacities available to the project. Events include recurring or exceptional happenings such as flooding, fire, frost, harvests, seasonal work, community gatherings and changes in use.
The categories are prompts, not boxes into which the living site must be squeezed. Their purpose is to reduce obvious omissions and reveal relationships worthy of closer investigation.
Use the public DAFOR field tool →
DAFOR: how abundant is it?
DAFOR is a simple descriptive scale commonly used in vegetation surveys:
- Dominant
- Abundant
- Frequent
- Occasional
- Rare
It helps a designer record relative abundance without pretending to have conducted a precise population count. The observation should state the surveyed area, season and date because abundance can change significantly across a site and through the year.
At Vila Pinheiro, DAFOR was used conventionally to examine flora and was also adapted experimentally to compare the availability and practicality of renewable-energy resources. That second use is an interpretation of the scale, not its standard ecological purpose.
PASTE helps answer what is here? DAFOR helps answer how much or how commonly does it occur? Separate Academy tool pages should later examine each method, its recording format, limitations and worked applications in greater detail.
Sector analysis: what moves through the site?
Sectors represent energies, materials, organisms and influences that enter, leave or move across a site. Unlike zones, sectors are not primarily defined by how often people visit them.
Common sectors include:
- sunlight and seasonal shade;
- prevailing and damaging winds;
- water movement and flood paths;
- fire exposure;
- cold-air drainage and frost;
- wildlife movement;
- access and traffic;
- noise, dust, pollution or spray drift;
- views into and out of the site;
- utilities and service corridors;
- social or commercial influences from neighbouring land.
The designer maps not only the presence of a sector but also its direction, timing, intensity and variability.
Sun
A solar sector should account for seasonal sun angles, topography, buildings and mature vegetation. It can inform the placement of food-growing areas, solar equipment, shade, living spaces and woodland edges.
Annual sunshine totals alone are insufficient. Winter access and summer overheating may lead to very different design responses.
Wind
Wind analysis considers prevailing direction, seasonal change, strong gusts, sheltered pockets and the effects of walls, hills and vegetation. The objective is not always to block wind. Ventilation, pollination, drying and energy generation may also matter.
Water
Water should be observed as movement across a whole landscape rather than as an isolated storage problem. Trace where rain lands, concentrates, slows, infiltrates, erodes, floods and leaves. Include roofs, roads, compacted surfaces, drains, streams, soil and vegetation.
Fire
In fire-prone landscapes, analysis should include likely approach, fuel type, slope, wind, access, evacuation, water availability and the maintenance required to keep protective measures functional. Specialist guidance and local legal requirements take precedence where life safety is involved.
Access, noise and views
Human sectors are easily overlooked. Routes determine effort and maintenance. Noise affects where people and animals can comfortably spend time. Valued views may deserve protection, while unwanted overlooking may require screening.
Resources, constraints and responsibilities
A site contains more than physical assets. Resources may include knowledge, time, labour, community relationships, skills, equipment, organic materials, existing vegetation, buildings, water, energy and finance.
Constraints may include legal restrictions, poor access, limited capacity, fire risk, steep slopes, compacted soil, unreliable water, conflicting needs or insufficient evidence.
The same feature can be both resource and constraint. A woodland may provide habitat, shade, biomass and beauty while also presenting fire, access and maintenance challenges. A seasonal stream may offer ecological opportunity while carrying flood risk.
Resource analysis should therefore ask:
- What is already available?
- What is currently wasted or underused?
- What must be protected?
- What requires ongoing care?
- Which resources are seasonal or uncertain?
- What depends on external supply?
- Whose labour or knowledge makes the resource usable?
Resources do not become free merely because no invoice accompanies them.
Zone analysis: organising relationships and frequency
Permaculture zones are a way of thinking about the relationship between people and the elements they use or maintain. They are commonly arranged from Zone 0, associated with the home or centre of activity, towards less frequently visited and less intensively managed areas.
Some contemporary teaching adds Zone 00 to examine the designer's inner condition, personal capacity or patterns of thought. That can be valuable, particularly in people-centred design, but this introductory land-reading guide retains the conventional Zones 0 to 5 so that the spatial and management relationships remain clear.
Zones are not decorative rings imposed on a map. Their placement should respond to actual patterns of use.
Zone 0
The home, building or principal centre of activity. Design concerns may include energy, water, comfort, storage, food preparation, household routines and connections with surrounding systems.
Zone 1
Elements requiring frequent attention or providing frequent harvests, such as kitchen herbs, propagation, daily compost inputs, small intensive beds or regularly used teaching spaces.
Zone 2
Less intensively visited but actively managed systems, which may include orchards, poultry, larger gardens, nurseries or storage.
Zone 3
Broader productive systems with lower visit frequency, such as field crops, grazing or larger orchards, depending on the site.
Zone 4
Managed semi-wild areas that may provide timber, forage, coppice, seasonal grazing or other extensive yields.
Zone 5
Areas in which ecological function, observation and learning take priority over production or intensive management. This may be wilderness, a deliberately low-intervention area, a protected habitat, an unmanaged edge or access to a larger living system beyond the project boundary.
Not every property can or should be expected to contain a separate parcel labelled Zone 5. Its form depends on scale, context and the ecological relationships surrounding the site. At Vila Pinheiro, the low-intervention area is a practical response to that particular property, not a universal land-design prescription.
These descriptions are guides, not commandments. A feature can change its practical zone as management changes. Several zones may overlap within a small or complex property. Social and organisational designs may also use the underlying idea of relative attention without reproducing a land-based map.
Sectors and zones are different lenses
Sectors describe moving influences; zones describe relationships of use and management.
A windy western boundary is a sector condition. A daily-harvest herb bed near the kitchen is a zone relationship. The two lenses interact: sector evidence may explain why a frequently visited element should not occupy the apparently nearest location.
Using only zones can produce convenient but environmentally naive placement. Using only sectors can produce technically informed plans that ignore human effort. Good design considers both.
An example in progress: reading Vila Pinheiro
Vila Pinheiro is a roughly one-hectare homestead in Central Portugal. Its Diploma survey brought together climatic, physical, ecological and human observations before detailed energy, water, food, woodland and animal designs were developed.
It is not a finished worked example and certainly not a universal template. It is an example in progress: a living property on which observations, assumptions, designs and interventions continue to be tested. In permaculture and regenerative farming there is no universal site template. Climate, landform, ecology, people, culture, resources and purpose alter the design every time.
The site-reading process considered:
- strong solar potential with important seasonal variation;
- predominantly northern winds with seasonal easterly influence;
- a long wet season followed by very dry summers;
- roof, paved-surface, storm-drain, stream and slope water flows;
- eucalyptus and pine woodland in relation to fire;
- eastern and western access routes;
- views, noise and utilities;
- orchard, hedges, woodland and existing habitat;
- the relationship between the house, frequently used growing areas and more extensive land systems.
The value of the exercise was not the production of several colourful maps. The maps informed later decisions. Solar observations fed the energy design. Rainfall, runoff and drainage informed the water design. Existing vegetation influenced the food-forest and silviculture designs. Access, shade, fodder and water affected the animal-system proposal.
The sector maps are particularly valuable for public teaching because they show how the same physical area changes when viewed through different lenses. A solar map, wind map, water map, fire map or access map does not describe a different property. Each reveals a different set of movements, risks and opportunities. Used together, they demonstrate why a single all-purpose map often conceals more than it explains.
The same evidence acquired new meaning as each design question changed. Site analysis is therefore cumulative, but it is never entirely finished.
Distinguish evidence from assumption
A practical site record can classify information as:
| Status | Meaning | Appropriate response |
|---|---|---|
| Observed | Directly witnessed and recorded | Use within the limits of when and how it was observed |
| Measured | Quantified through a stated method | Check accuracy, units and relevance |
| Reported | Supplied by a resident, worker, neighbour or source | Record who reported it and seek corroboration where needed |
| Inferred | A reasoned interpretation of available evidence | State the reasoning and retain uncertainty |
| Assumed | Treated temporarily as true without adequate evidence | Do not base irreversible action on it |
| Unknown | Relevant information not yet available | Observe, investigate or design a safe trial |
This discipline prevents a diagram from becoming more certain than the knowledge beneath it.
Move from observation to intervention carefully
Site analysis does not remove uncertainty. It helps the designer respond proportionately.
Where evidence is limited:
- begin with small and reversible actions;
- protect existing functioning systems;
- test in a limited area;
- establish what will be monitored;
- define a review point;
- retain the ability to stop or change course.
Where consequences are serious, such as structures, electrical systems, potable water, wastewater, dams or fire safety, appropriate professional expertise and regulatory approval are part of the design.
A site-reading checklist
Before developing a concept design, ask:
- Is the purpose and scope clear?
- Have the relevant people participated?
- Is there a usable base map?
- What has been observed across time and seasons?
- Which sectors materially affect the design?
- What resources already exist?
- What limits, risks and maintenance burdens apply?
- How do people currently move through and use the site?
- Are proposed zones based on real relationships and visit frequency?
- What is measured, reported, inferred, assumed or unknown?
- What can be trialled reversibly?
- When and by whom will the observations be reviewed?
The map is an invitation to keep looking
A site map freezes a moment. A living landscape does not.
Good site reading combines patient observation with purposeful enquiry. It studies both ecological forces and human patterns, then uses multiple lenses to reveal relationships that no single map can hold.
The outcome is not certainty. It is a better-grounded design, clearer limits and a more intelligent next step.
Where this material comes from
The site-reading sequence is an Academy teaching synthesis of established observation, sector, zone and field-recording practices. The Vila Pinheiro example comes from Mark D’Cruz’s Design 03 Diploma record; it documents his application and does not claim invention of the inherited methods.
- Permaculture Association, “Design Methods”.
- The Heritage Council, Best Practice Guidance for Habitat Survey and Mapping, including the conventional DAFOR abundance scale.
- Mark D’Cruz, Design 3 and later land designs within the Applied Permaculture Diploma journey.