Quantitative and decision tools · Tool 11 of 12
Water Budget, Catchment and Runoff Calculations
Quantify water supply, demand, storage, timing, losses and safe overflow before selecting infrastructure or claiming water security.
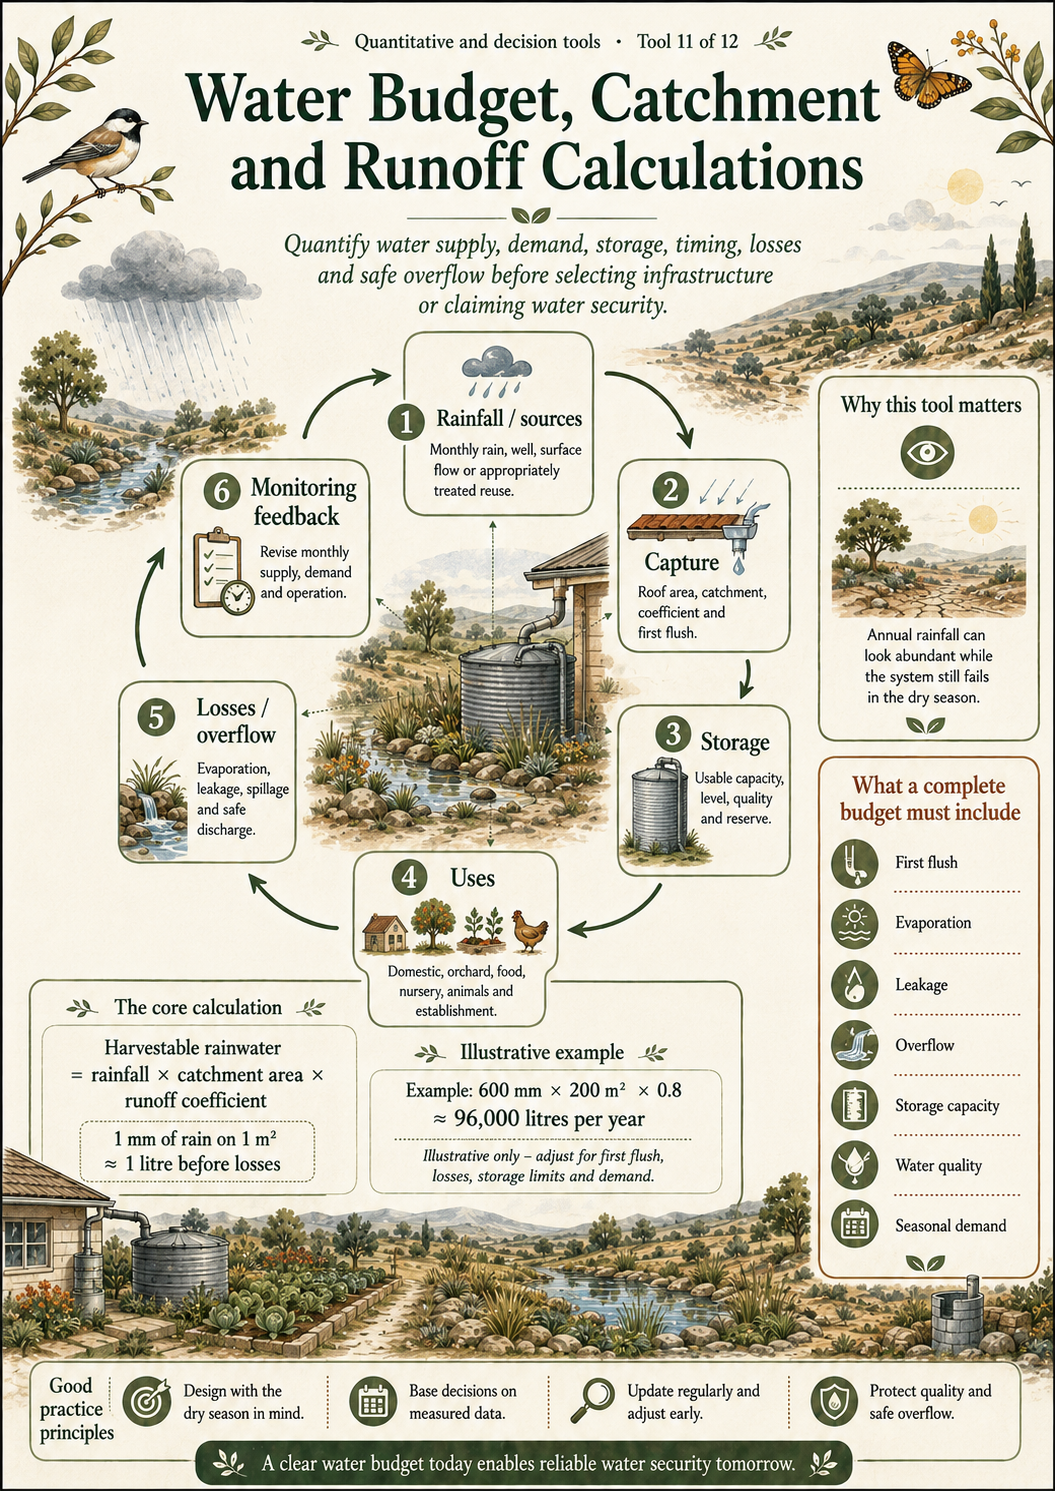
The detailed article and accessible semantic visual below provide the complete HTML text equivalent of the infographic, including its method, cautions and interpretation.
Why this tool matters
Annual rainfall can look abundant while the system still fails in the dry season. A water budget connects when water arrives, how much can be captured, what storage is usable, when demand occurs and where overflow or loss must go safely.
What the tool is
At introductory level: harvestable rainwater = rainfall × catchment area × runoff coefficient, with consistent units. One millimetre of rain on one square metre is approximately one litre before losses. A complete budget also accounts for first flush, evaporation, leakage, overflow, storage capacity, water quality and seasonal demand.
Origins and disciplinary context
Water budgeting draws on hydrology, water engineering, agriculture and resource management. Permaculture design integrates these calculations with soil, access, vegetation, maintenance and ethics, but does not replace competent engineering where consequences are significant.
The tool at a glance
Iterative water budget from rainfall and other sources through capture, storage and uses, then losses and overflow, with monitoring feedback returning to source and demand assumptions; an illustrative 600 millimetre by 200 square metre calculation is shown.
- Rainfall / sourcesMonthly rain, well, surface flow or appropriately treated reuse.
- CaptureRoof area, catchment, coefficient and first flush.
- StorageUsable capacity, level, quality and reserve.
- UsesDomestic, orchard, food, nursery, animals and establishment.
- Losses / overflowEvaporation, leakage, spillage and safe discharge.
- Monitoring feedbackRevise monthly supply, demand and operation.
When to use it
Use before sizing tanks, ponds, drains, swales or irrigation and whenever demand, climate, land cover or storage changes. Work monthly or seasonally in climates with wet winters and dry summers.
How to use it
- Map sources and catchments with units and time periods.
- Use appropriate runoff coefficients and documented losses.
- Estimate usable storage, not nominal volume alone.
- Build monthly or seasonal supply series.
- Estimate demand by use, season and establishment stage.
- Protect an emergency reserve where required.
- Test dry sequences, overflow routes and failure conditions.
- Monitor actual levels and use, then revise assumptions.
What to record
Record rainfall source and period, catchment area, surface, coefficient basis, first-flush and filter assumptions, storage volume and usable range, opening and closing level, supply, demand by use, losses, overflow route, water quality constraint, uncertainty and safety review.
Worked example
Illustrative roof calculation: 600 mm × 200 m² = 120,000 litres theoretical annual rainfall landing on the roof. Applying an example coefficient of 0.85 gives 102,000 litres before first flush and other losses. That still does not show whether a tank can bridge the dry season; use monthly rainfall, demand and storage balance.
Connection with Mark’s Diploma practice
Design 05 analyses rainfall, roof and wider catchment, runoff assumptions, swales, storm drains, pond or tank storage, drip irrigation, well supply and overflow. Some figures conflict across the main design and appendices, including pond capacities and catchment claims. This page therefore cites the design context but does not reproduce uncertain totals as authoritative.
Diploma source locators
- Design 05, PDF page 10: monthly rainfall and seasonal variation.
- Design 05, PDF pages 11 and 13 to 15: catchment area, rainfall, land-cover runoff assumptions and catchment estimates.
- Design 05, PDF pages 16 to 25: connected rainwater, drains, swales, pond, overflow, storage and irrigation design.
- Design 05, Appendix 03, PDF page 42: maintenance and monitoring of storage, swales, irrigation, water quality and rainfall or storage data.
- Design 05, Appendix 04, PDF pages 43 to 46: system specifications and water-catchment calculations, including the 600 mm × 1,000 m² statement on PDF page 44.
Interpreting the results
Examine the monthly balance, minimum storage level, overflow frequency and sensitivity to dry years or higher demand. Adequate annual supply is not water security. Coefficients and demand estimates are assumptions until checked against the actual system.
Limitations
- Rainfall averages hide sequence, intensity and drought.
- Runoff coefficients vary with surface, condition and event.
- Nominal tank or pond volume may exceed usable storage.
- Water quality can restrict use even when quantity is adequate.
Common mistakes and misuse
- Mixing millimetres, metres, litres and cubic metres.
- Applying a coefficient twice or not at all.
- Ignoring first flush, evaporation, leakage and overflow.
- Sizing earthworks from a simple annual calculation without slope, erosion, downstream and professional review.
Relationship to other Library tools
Reflection and application questions
- Which month produces the minimum usable storage?
- What happens when the store is full during intense rain?
- Which assumption most changes the result?
References and further reading
- Food and Agriculture Organization, “Rainfall and evapotranspiration”, including the one-millimetre-per-square-metre relationship.
- UK Government, National standards for sustainable drainage systems, catchment, runoff and safe drainage context.